Understanding the Quality Score Can Help You Get Ahead With AdWords
The Google AdWords Quality Score was designed with the intention to promote quality ads on search queries. Instead of Quality Score, we could alternatively call it your Trust Score. Google sees how your ads have performed compared to other advertisers on the same query within a reasonable period of time. They then make bidding on the keywords associated with the query more, or less, expensive. In this way, Google acts like Santa Claus. Good advertisers will get good results, and bad advertisers will get coal.
But the Quality Score is not what it seems. It is not one simple number, that’s just how it is shown to you. Behind the curtain lies a myriad of moving parts. Your own QS is like a melting pot of Quality Scores thrown in together. This can be confusing, and it makes it difficult to improve the results.
What Other Quality Scores Are There?
Geography – How are your ads performing for individual cities, metros, or states? If your ads are running nationwide, you may be performing well above average for Wyoming but below average for California. California is roughly a sixth of the United States population, and its share of impressions is, well… impressive. That may make it worth your while to split California out into a separate campaign to test different ads.
Device – Users on smartphones and desktops act differently. A user may be more likely to call on a smartphone. They may be more likely to complete a form on a desktop. If you’re not running ads for all device targeting and mobile preferred ads simultaneously, how can you really optimize your QS? My first recommendation is to start by testing different Calls-to-Action.
Other Accounts’ QS – Ever wonder where AdWords gets the initial Quality Score for keywords you’ve just added on a brand new account? Simply put, it is looking at the average performance of past advertisers for that keyword. Oddly enough, there are keywords that have maximum scores well below 10, and Google will never reveal what that maximum is. Their thinking is simple: how can you possible serve an ad that answers enough of the queries for certain broad terms (ex. ‘mortgage’)? If you’ve started an account, and some of the keywords are starting with a QS of 1 or 2, consider removing those. That most likely means that other advertisers have done terrible on that keyword. On the other hand, it is also possible your landing page is ill-suited to the task.
Per-Query Ad Rank – Every single keyword that is eligible to be triggered for a query is given a predicted Quality Score. This uses the actual Quality Score as the base, but then it predicts how how the associated ad will perform and adjust the Ad Rank based on that. This may mean that your average position on a select few queries is fairly decent, while on the rest of the queries a keyword is eligible for the average position is low. While the average position can seem to lie to you, segmenting your ad groups and campaigns into tighter groupings can alleviate a lot of this problem. Also, negatives, negatives, negatives. Have I mentioned negative keywords before?
Reported QS vs Real QS – Google keeps the data for your actual keyword data separate from the data that is reported. This means that the reported data may not be the most up-to-date. On very rare occasion, widespread reporting errors have also surfaced. It helps to have a reporting log of all the Quality Score throughout your account, which can be done via AdWords Scripts. Keep in mind that if something seems terribly off, it’s always good to check other sources.
Historical Data – Your historical click-through-rate, how the specific Display URL has performed in the past, and even the how the other keywords in the same ad group are doing is measured into a keyword’s QS. If you’re getting low scores, shake it up. Move them into different ad groups. Test new ad copy. If needed, don’t be afraid to dump a keyword. Low Quality Scores can act like an anchor that weighs down everything you do.
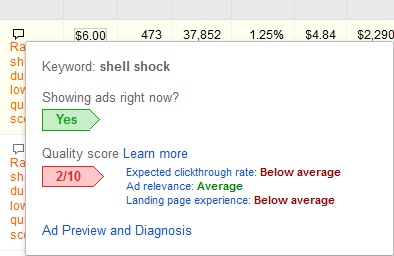
Ad relevance/Expected click-through-rate/Landing page experience – These are the stats shown when you hover over a keyword’s status bubble, as shown below. Google is making a prediction, which is sometimes totally wrong. But, if they think it is bad, maybe it is. Also, make your landing page usable and relevant. A plumbing landing page isn’t going to do very good on a real estate keyword.
Ad Extensions – Google factors in whether you have ad extensions setup and how they’re performing into part of your Quality Score. Running Call Extensions in the middle of the night, and no one is using them to call you? That might hurt you. Google sitelink and Call Out description can go a long way toward improving your cpc’s.
One last note – The QS of a keyword doesn’t just dictate its average position and cost-per-click. It also dictates the variety of queries it is eligible to appear on. At a lower level, it can also begin impacting the Search Impression Share. Remember what I said earlier about it being a Trust Score. Google needs to trust that your keyword is not wasting their opportunities for clicks.
Conclusion
I’ve unloaded a lot of details that you may or may not have known about before. But, I believe it’s clear that structuring your account to make sure you have the best ads for every single keyword is the only way to ensure you have the best Quality Score possible. While it’s not the only metric that matters, it can make or break your accounts.
Now, go make some money!