The Misleading Stat That Destroys CTR Analysis
I have fallen for it many a time. I have looked at my click-through-rate and immediately felt great or terrible. Really, I have no idea what my CTR is supposed to be. I mean, none of us can really know that. We can only check our Quality Score to see how we’re doing relative to everyone else.
Of course, even mentioning Quality Score quickly reveals another misleading amalgamation of factors, but I digress. Today, I’m just going to focus on the Average Position stat, and why it is so wrong; why it makes you do the wrong tasks by action or by inaction.
Understanding the Problem
In my previous post about How To Use AdWords Segments, I talked about the ‘Top vs. Other’ segment, ‘Network’ segment, and ‘Network (with search partners)’ segment. This is one of the first methods of determining what the Ad Position stat really means.
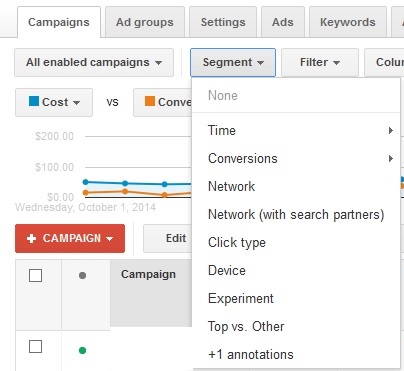
Top vs. Other – Google AdWords allows desktop ads to show up above the organic listings, to the right of them, or below them at the very bottom. On the other hand, Google cannot dictate to its Search Partners like AOL, Ask.com, or any number of the myriad publishers that use the Google Search Application, where the ads should be displayed. Just imagine a more informational query that has no ads at the top, while your ad is the only one at the bottom. Your ad would be number one but would have very little likelihood of getting clicked.
Network – Search Partners may or may not display your Ad Extensions. That is really up to the Search Partner to decide. Additionally, they may display as many ads as they like with as many in each position as possible. I performed a quick search for a competitive query on AOL.com. In that instance, I saw the five ads at the top, five ads to the right, and the same five ads at the top were repeated at the bottom. Pull your hair out often? Now is a reasonable time to begin.
Device – Enhanced Campaigns irrevocably changed the rules for everyone. You can’t target smartphones on Search without also targeting desktops and tablets. You can’t split tablets and desktops out on Search at all. Some Phablets might show three ads at the top whereas many normal sized smartphones show two ads at the top, and three at the bottom. The latest changes to the way mobile ads are handled might mean three ads are more commonplace on regular-sized smartphones. The possibilities are dizzying.
Search Terms – There are a couple ways to look at the search queries. The most granular method is to navigate to the ‘Keywords’ tab from the Campaign, Ad Group, or Account level. At this point, you may check the box next to one or more keywords, select ‘Details’, and then click ‘Selected’. You may alternatively choose ‘All’. This particular view is slightly different that the similar option in the ‘Dimensions’ tab because you may select individual keywords for this exercise and because it has a row called ‘Other search terms’.
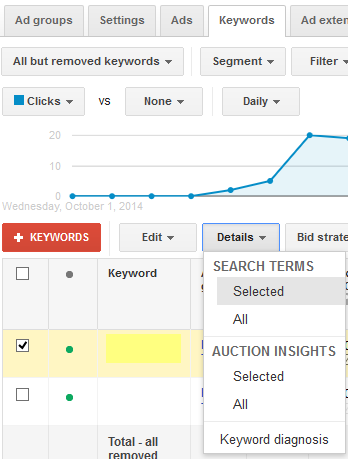
One thing that always stands out about ‘Other search terms’, aside from a lack of query data, is that the Average Position is so much different than the queries that are displayed as is the click-through-rate. It’s a little black box of information. While Google scrubs queries from the reporting that may show personal information of the user, like Social Security Numbers, credit cards, and addresses, they also filter out low searched queries. This data would certainly be useful in fleshing out additional negatives or keywords to target.
You will also notice that each query has its own average position. A query Google considers your ad extremely relevant for will likely have a better position, depending on the competition. Other terms may not have a worse position
Time – Am I starting to drive you crazy, yet? Well, your ads may be at different positions at different times. If it’s peak times for your industry, your competitors are likely bidding higher. Holidays, middle of the night, lower competition on mobile after certain times? It all starts to become overwhelming if you think about it too hard.
Geography – The ‘Dimensions’ tab has a ‘Geographic’ option. There are a number of columns that can affect what is reflected here, as the user may have seen your ad, been way outside your targeted geography, and Google decided they might be relevant to show ads too. I’ll bet your ads shown to California users may be in a slightly worse position than to users in Michigan.
What To Do About All This
Don’t stress too much about something outside your control. Check your Quality Scores, and keep your bids competitive where they need to be. All of this was really just an exercise in highlighting how much the stats Google AdWords present may not be the entire truth. I didn’t even comment on Enhanced CPC that can change your bids, or personalized search results that may make your ad’s position worse or better depending on the person.
Data paralysis can lead you to not make changes when you really should. This is why PPC managers begin focusing their campaigns in a more granular fashion. That makes it easier to understand what is really going on with your account.
Now, go make some money!