Today starts part two of our Google Analytics workshop! Last week we covered getting set up with the interface, and today we’ll get a little more familiar with running and reading a report analysis.

Standard Report Analysis
When you launch Google Analytics, you need to know what you’re looking to find or measure. What are you inquiring about?
I wonder how long people are spending on my landing pages?
I wonder where my search traffic is coming from?
I wonder which links are getting clicked on the most?
If you are asking “I wonder” type questions, you can find the answers in the default reporting systems GA provides you; let’s go through some of those features:
As we discussed last time, you can set the calendar feature to put a time limit on your goals. When you do so, you are also generating the time frame for which you want to conduct your report analysis. The report can be as long or short as you like; allowing you the opportunity to measure daily,weekly, monthly and annual trends.
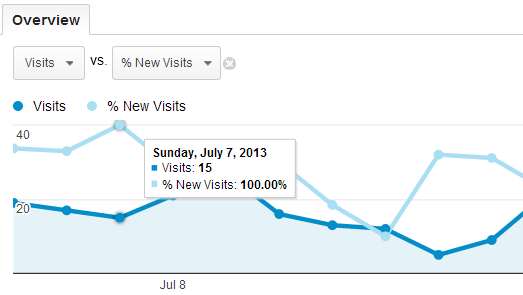
When you launch Google Analytics for your site, the first page you will see is the Audience Overview. This view shows you metrics like page views, unique visitors, visit duration, bounce rate etc. for a specified timeline. One of the cool things you can do in this view is compare metrics against each other. For example, I was able to examine how many of my page views were from new or returning visitors by comparing “Visits” to “% New Visits”
To look at more in depth analyses for a given metric, you can toggle through the various reports in the navigation bar to the left of the page:
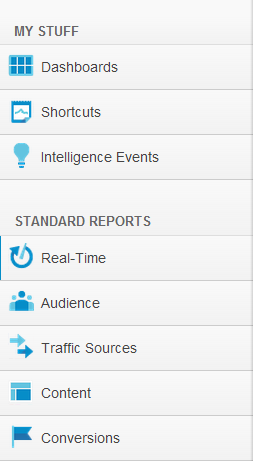
Google Analytics is great for report analysis because it allows you to graphically measure and evaluate many different factors, giving you a complete picture of your online presence. Under these tabs you can track and create reports for things like:
- real time visitor information
- demographic information
- behavioral paterns, i.e. time spent on site and bounce rate
- traffic sources
- conversions and transactions
- top performing pages and links
For more casual monitoring, you can create a private dashboard for your site, under the “Dashboards” tab. Here you can customize which widgets and apps you would most like to track by putting them all in one convenient place.
Building a Custom Report
Building a custom report or using advanced segmentation techniques is more appropriate if you’re asking “if this, then that” types of questions like:
Of all of my visitors this month, how many were new visitors?
Of all of my pageviews, how many were unique and how many were repeat?
Which of my visitors are in my target market segment?
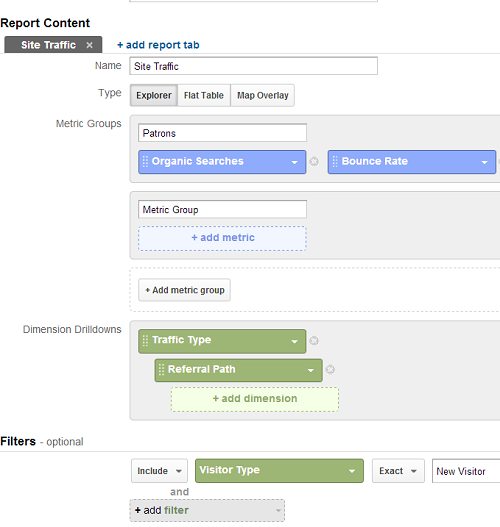
If you’re asking these types of questions, and want to measure for a specific metric, or compare certain metrics together, you may do so in a custom report. This may be done by going to the orange bar at the top of the page and clicking Customization > New Custom Report. Here you can create different tabs based on the metrics and dimensions you want to analyze. Each tab is another element of your report. Then you can choose metrics to measure a specified dimension, and filter for a certain result, like so:
Building a custom report analysis is helpful in that it allows the user to generate data that is specific to their goals and models. Creating custom reports can give you a more in depth look at how well your objectives are being accomplished, as well as help you draw parallels between trends; i.e. Where is my traffic coming from, and at what time of day? Which pages are the most popular, and why? Learning these trends is key to understanding your audience and creating a better on-site experience for your visitors; and the better the onsite experience, the better the metrics will be.
As we mentioned earlier, you can also find answers to more complex inquires such as these with GA’s Advanced Segmentation techniques; but we will get into that next time, in our final workshop when we cover more advanced techniques to help you make the most out of Google Analytics.