In my previous post, I discussed setting up Google Analytics access for this spreadsheet using a Google Drive script, and enabling your Analytics API. So now that you’ve gotten your Drive API scripts working, and your API keys are ready to go. If you have not performed the tasks in the previous post, you MUST go back and follow those steps. Otherwise, this spreadsheet will not work for you. Otherwise, to get started, download this file.

Features
- Query Google Analytics and write data directly to Excel spreadsheet
- Up to date with Analytics dimensions & metrics names
- Access to Multi-Channel Funnel data
- Online storage of your report configurations
- Ability to automatically refresh reports (ie: monthly reporting)
- Exports your reports to a new workbook for sending to other people (Not working on Mac yet)
- Works for Windows & Macintosh
- It’s Free
Couple things to note:
- This could be considered beta right now. If you have errors, please let me know and I will do my best to fix them.
- Creating anything for Excel on Macs is terrible. There were a few trade offs in order to make this work on both platforms, but nothing too off putting.
- You MUST enable macros when you open this spreadsheet. That’s where everything happens.
- You must complete part 1 first before you can begin using this spreadsheet.
Getting Started
So now that you have opened this spreadsheet, the first thing you need to do is add in your credentials. Remember in the previous post how I told you there were 3 things you would need? If not, before we can continue, we need:
- Google Drive web apps URL
- Your API client ID
- Your API client secret
If you forget your client ID & secret, just go visit the Google Code Console to retrieve it. As far as the URL we need, it should have been given to you when you deployed the RankHammer Excel API Proxy script as a web app. If you didn’t follow those steps, the person who did will share that URL with you. Once you have all three of these items, please proceed…
Authenticating
Open the downloaded spreadsheet above (make sure Macros are enabled when opening). There should only be one tab visible, the welcome screen that looks like this.
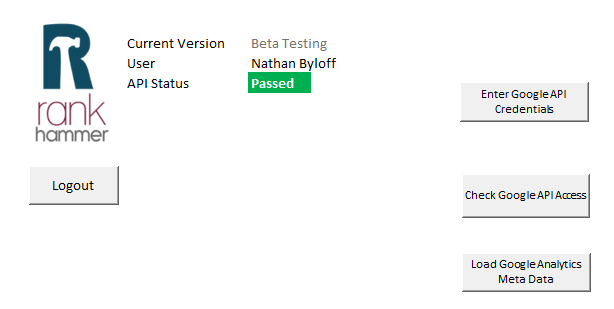
This is what each button does:
- Enter Google API Credentials: This is where you will paste the URL, client ID, and client secret. It is used for generating your personal access token for fetching data.
- Check Google API Access: Uses the stored access token to fetch your user profile. Used as a test to make sure everything is working OK.
- Load Google Analytics Meta Data: Fetches all your account profile information as well as all dimensions, metrics, and segments necessary to use the spreadsheet.
- Logout: Clears your authentication data and profiles.
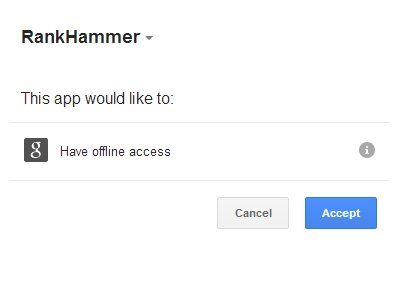
Go ahead and click the “Enter Google API Credentials” button and paste in the URL, client ID, and client secret and click save. When you do this, it opens your browser and attempts to connect to Google for authentication. If you are logged into more than one Google account, it will ask you to choose an account. Make sure you click the account where you enabled the Drive API for yourself. You will then see a screen like this. Click “Accept”.
It will then redirect you to a page with a code. Copy that code, and return to the spreadsheet. There should be a window open waiting for input. Paste the code there and click OK. Once you do this, you should see your name in the upper left along with the words “Passed”. MAC USERS PLEASE NOTE: For some reason, it fails on the first try and says “Invalid Credentials”. If this happens to you, click the second button “Check Google API Access”. It should work for you then.
The only thing left to do now is click the “Load Google Analytics Meta Data” button. That will run for a few seconds, and once complete, you should have a new “Google Analytics” tab as well as a “GA Legend”. If so, let’s get started!
Using the Spreadsheet
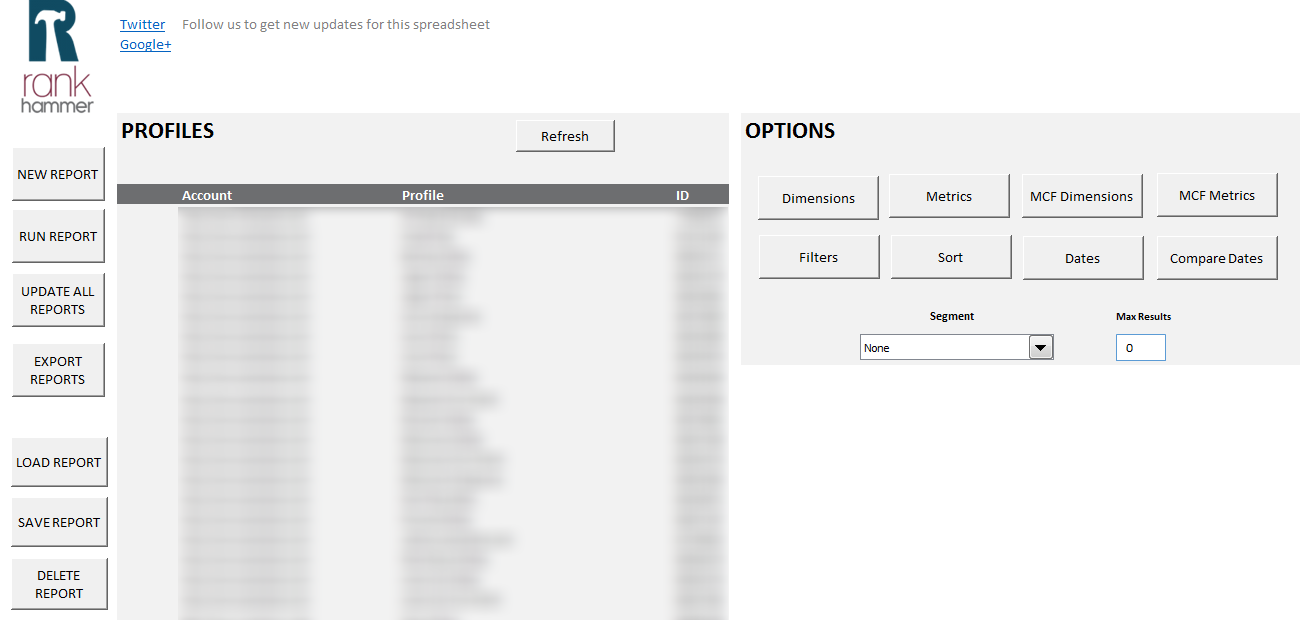
The Buttons
- New Report: Clears everything configured in the “Options” view on the right. Resets the view so you can start a new query.
- Run Report: Executes a Google Analytics query based on the configured options you selected on the right. Don’t forget to select a profile too!
- Update All Reports: Finds all previously run reports within this spreadsheet, and runs the queries again. Useful for monthly reports. Like if you chose “Last Month” under the “Dates” option, it will automatically update your start and end dates each month.
- Export Reports: Exports any of the queried data, or custom worksheets with charts, tables, etc. Into a new workbook. Useful if you want to send this information to another person, and don’t want to give them access to run queries with this Workbook. (MAC USERS: Sorry, not working right now).
- Load, Save, and Delete Report: If you configured an account on parse.com (see part 1 post) and pasted your API key & secret within the Google Apps script, this is how you saved report configurations for using later, or sharing with other people. For example, say you configure a Analytics query, run it, and get all the data you like stored. You can save that configuration, and then sometime in the future, say you want to create that query/report again for another profile. Instead of going through and choosing all the dimensions & metrics all over again, you can just click “Load Report” and it will pre-configure everything for you based on what you had saved.
The Options
I won’t cover all the details here as you probably know what it all means, but there’s a couple things to note:
- “MCF” stands for Multi-Channel Funnels. If you want to use this API, that’s where you configure the parameters needed.
- You must at least select one metric and/or one “MCF” metric.
- You can select a date, and a date to compare against. For instance, if the date you select is “Last Month” and you want to see the same query for the same month in the previous year, you can click “Compare Dates” and choose “X months ago” and enter the number 13.
- Before you can run a report, you must select at least one profile from the profile list. There are a couple of instances when you may have a profile selected, but the spreadsheet tells you that you don’t. If this happens, unclick and click the profile again. If that doesn’t work, click the “Refresh” button at the top to reload your profiles, and try selecting one again.
- If you select a custom date, you will have to configure a new report in the future, if you want to re-run it. It will always be configured with the date you entered.
- When you click run, you must click where you want the data to be dumped. If you selected more than one profile, you have to choose the cell each time.
And that’s pretty much it! Again, this is just the first version, and I plan on doing some tweaks and fixes as I go along. I will post updates online as I make the changes. Let me know if there are any problems, or you have questions, or feature enhancements, and I will do what I can to make it happen.